Project profitability from employee cost and client billing rates
Revenue minus cost, on the same record that holds the hours. The billing model sets the revenue basis and the employee record sets the cost, so every project carries a margin you can trace back to a salary and a rate.
- Companies
- 200+
- Hours tracked
- 50M+
- Holidays taken
- 50,000+





How Growee computes project profit
Growee computes project profit as revenue minus cost on the same record that holds the hours. The revenue basis follows the project's billing model, one of six: retainer, fixed price, time and materials, PPC passthrough, revenue share, internal. Cost comes from one of three places: an internal cost hourly rate on each timesheet row, an explicit fixed monthly cost for a member on that project, or, for a salaried member with neither set, that person's own monthly cost or salary, prorated by their weekly allocation when it is set below 40 hours. At 40 or more, which is the default, the full monthly cost lands on that project.
The hours come from time logging, the invoiced side comes from invoices, and both sit on the same project record as the team and its rates. Agencies running this end to end can read the wider setup on Growee for agencies, or the row-by-row Harvest alternative comparison.
Revenue basis by billing model
Every project carries exactly one billing model, and the model decides where its revenue is read from.
| Billing model | Revenue basis |
|---|---|
| Retainer | Invoiced amounts when anything is invoiced on the project, otherwise the configured budget. |
| Fixed price | Invoiced amounts when anything is invoiced, otherwise the configured budget. |
| Time and materials | Invoiced amounts when anything is invoiced, otherwise billable hours valued at each person's billed rate. |
| PPC passthrough | Invoiced amounts when anything is invoiced, otherwise the configured budget. |
| Revenue share | Invoiced amounts when anything is invoiced, otherwise the configured budget. |
| Internal | No revenue at all. An internal project reports cost only, so it never carries a margin. |
A worked retainer example
A retainer billed at 8,000 EUR a month, invoiced, with two people on it.
- Revenue: 8,000 EUR
- A retainer is fee based, so the invoiced amount is the revenue once anything is invoiced. Before the first invoice it would read the configured budget instead.
- Cost, salaried designer: 3,200 EUR
- They sit on the project at the shipped default weekly allocation of 40 hours, so their whole monthly cost lands here. They logged 62 hours. Logging 40 or 80 would not change the figure, because a salaried member is costed monthly, not per hour.
- Cost, hourly developer: 1,440 EUR
- They are paid hourly and logged 48 hours at an internal cost hourly rate of 30 EUR, snapshotted onto each timesheet row as they log it.
- Margin: 3,360 EUR, or 42 percent
- 8,000 EUR of revenue less 4,640 EUR of people cost. Twenty more hours from the developer adds 600 EUR of cost and pulls the margin down to 2,760 EUR while the invoice stays where it was. That is the overservicing a flat fee hides.
Project expenses allocated to the project are added to people cost in the same view. Figures here are illustrative.
Who can see the margin
The margin, the billed rates, the budget and the billing model are gated behind two permissions, manageSalaries and managePayroll. Admin is the only default role that carries them, so in a new workspace the margin is admin-only until an admin grants one of those permissions to someone else. A project manager or an account lead does not see project margin unless an admin deliberately gives them one of those permissions.
The same numbers are readable over the API and over MCP under the caller's own permissions. The field list is in the developer reference.
Every project's true cost, in one place
Growee ties clients, budgets, logged hours, salaries, expenses and invoices into one live picture of profitability: budget versus actuals for every project, without a spreadsheet.
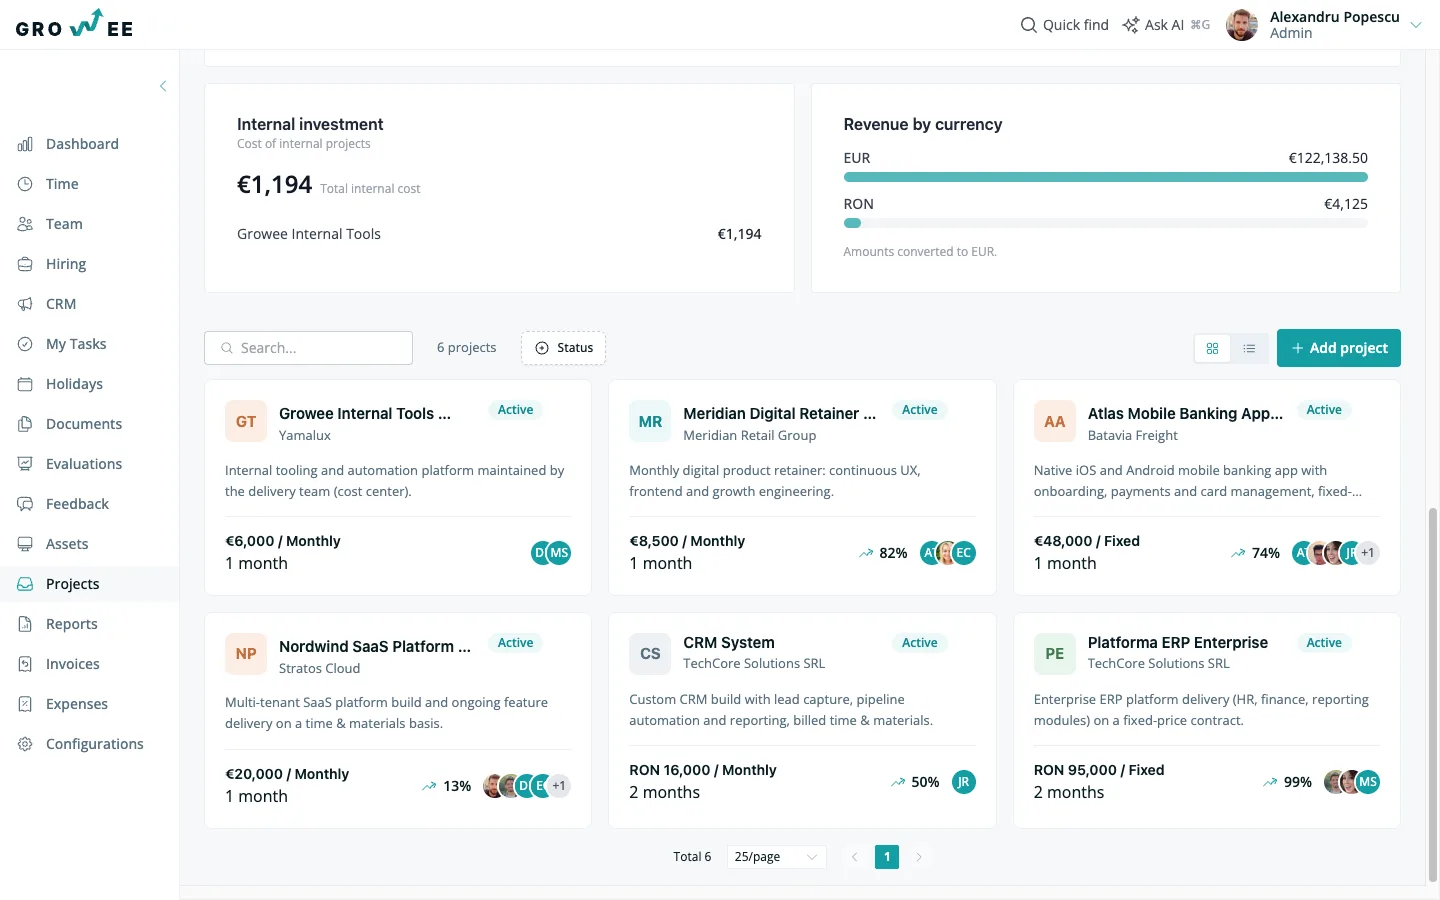
Every project, one portfolio view
Your whole project portfolio lives on one screen, organized the way your team actually runs it.
- Grid or list view: switch between a visual card grid and a dense table on the same data, no page reload.
- Client, budget, and team at a glance: each project shows its client, budget, billing model, and team avatars before you click in.
- Live margin per project: revenue, cost, and margin sit right on the card, so the weakest project is obvious.
- Active and archived: archive finished projects to keep the list clean while every number stays in reporting.
Set up a project in minutes
A new project captures the commercial reality in one short form: no template wrangling, no consultant.
- Client, name, website, logo: link the project to a client so every hour, expense, and invoice stays organized per relationship.
- Four budget types: a fixed lump sum, or a recurring weekly, monthly, or yearly budget. Match it to how you actually bill.
- Six billing models: retainer, fixed price, time & materials, PPC passthrough, revenue share, or an internal cost center.
- Start and end dates: set the project window and costs clamp to it automatically. Nothing bleeds in from before or after.
Real costs, not estimates
Growee builds each project's cost from the hours your team logged and the salaries you actually pay.
- Three cost sources, resolved per member: an internal cost hourly rate on the timesheet row, an explicit fixed monthly cost for that member on that project, or the person's own monthly cost, prorated only when their weekly allocation is set below 40 hours.
- Revenue basis per billing model: revenue comes from invoiced amounts, the configured budget, or billable hours, whichever fits the model, resolved for you.
- Loaded cost, not a guess: people cost and allocated project expenses roll into one loaded-cost figure built from the salaries and rates you already hold in Growee.
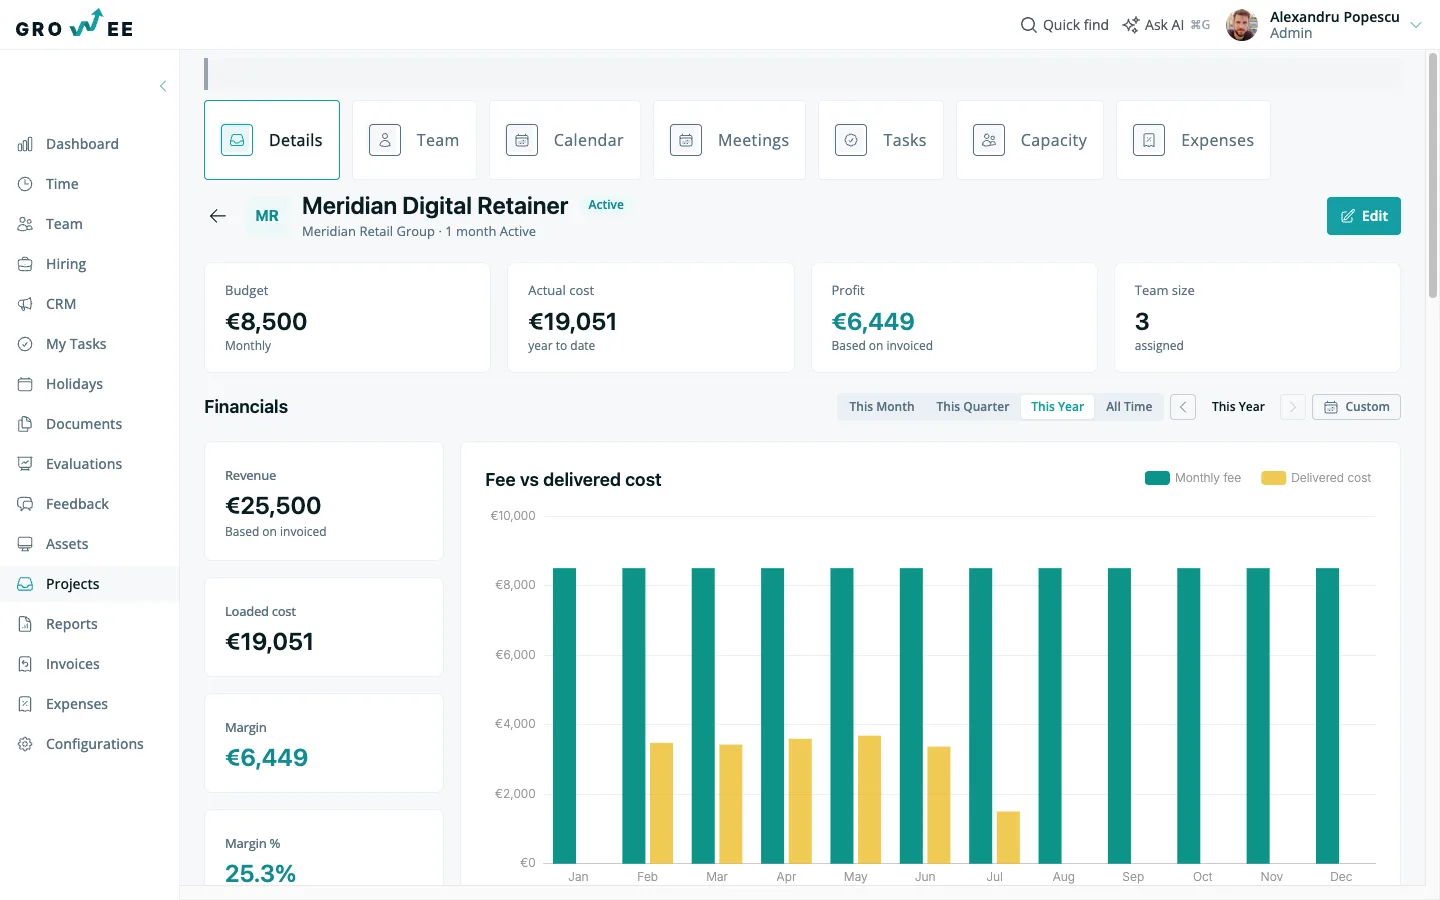
- Margin and margin %, side by side: revenue minus loaded cost, shown as both an amount and a percentage, right next to the chart.
Revenue against cost, month by month
The project overview reads like a running P&L, so you see where a project is heading before it ends.
- Billable revenue and cost side by side: the monthly chart plots what you can bill against what delivery costs, with the profit line tracing the gap between them.
- Period picker with navigation: step across month, quarter, year, or a custom range with prev and next arrows.
- Timeline clamped to the project window: costs and revenue only count inside the project's start and end dates, so short engagements read honestly.
- Billing-model-aware KPIs: the budget, revenue, cost, and margin cards adapt to how the project is billed.
A billed rate and weekly hours for every person
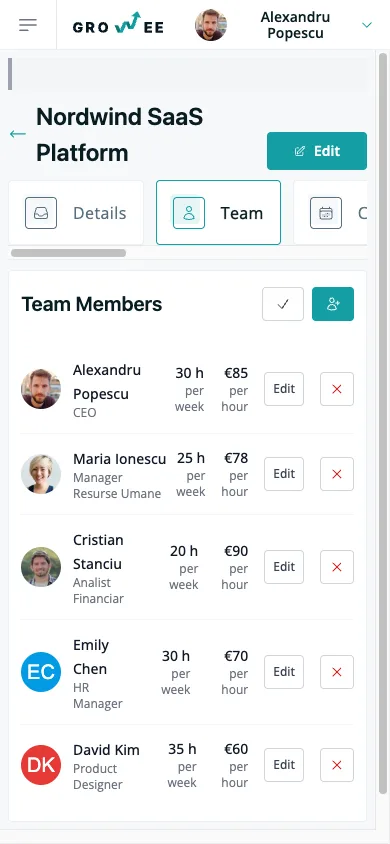
Assign anyone to a project with the two numbers that plan the work: what you bill for their time, and how much of their week it takes.
- Billed rate per member: set what you charge the client for each person's time (say, €85/h on this project).
- Weekly allocation per member: define the expected hours per week for each person, so capacity is planned rather than guessed.
- Build the roster in seconds: add anyone from your existing team and edit their rate or hours inline, without leaving the project.
- Rates feed straight into margin: those billed rates become the billable value you'll see in team economics next (no re-keying).
See who's over- and under-allocated
Per-member economics turn logged time into utilization and margin, so overservicing shows up before it eats the budget.
- Worked versus expected hours: compare hours logged against the weekly allocation for every member on the project.
- Utilization percentage: see who is stretched thin and who still has room for more work.
- Margin per member: billable amount minus internal cost, per person and for the whole team.
- Fee-based summary: on retainer and fixed-fee projects, weigh total team cost against the monthly fee in one line.
Tasks and calendar on the project
The delivery side lives next to the money, so scope and cost never drift apart.
- Project tasks: create and track tasks against the project, filterable by timeline.
- Default tasks on creation: a new project starts with a task scaffold instead of a blank board.
- Shared calendar: a project-specific calendar view for events and scheduling.
- Meetings linked to the project: keep meeting notes and context attached to the right project.
Expenses and invoices feed the numbers
The costs and revenue you record elsewhere in Growee roll straight into project profitability: no exporting between systems.
- Allocate expenses to a project: an editable expense table assigns direct costs to the project, so they land in the cost breakdown.
- Expense bundles: group related expenses and allocate the whole bundle in one move.
- Invoices linked to projects: tie invoices to a project so invoiced revenue sits right next to budget and cost.
- Multi-currency, one reporting currency: each currency converts into your reporting currency, with unconvertible amounts tracked separately.
Read the whole portfolio at a glance
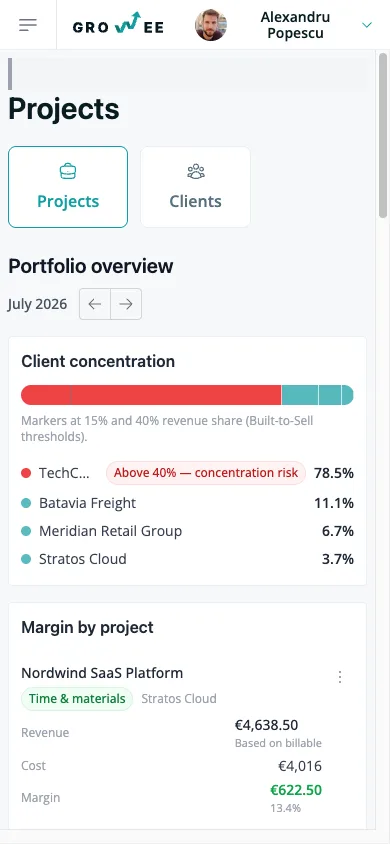
Above the project list, a portfolio dashboard answers the questions a founder actually asks.
- Client concentration: see each client's share of revenue and spot single-client dependency risk early.
- Margin leaderboard: rank projects by margin and margin percentage, so the best and worst are one glance apart.
- Internal burn: isolate the cost of internal-only projects from client-facing work, so overhead is visible.
- Currency mix and month navigation: see revenue by currency and step month to month to watch the trend.
Your portfolio has a second brain
Growee's AI doesn't sit beside your projects. It reads every budget, logged hour, rate, and invoice directly. Profitability, utilization, and forecast all draw from the same numbers, in real time.
The part that's easy to miss: every project number is queryable straight from your AI assistant, through MCP, the open standard that connects AI assistants directly to your data. Ask which projects lost money last quarter, which client drives half your revenue, or who's under-allocated next month, and get an answer without opening a report. Pair it with Ask AI and it's less an assistant bolted onto reporting, more a second brain that already knows your portfolio.
Everything you'd bolt on with Harvest, Toggl, or a spreadsheet, already in your HR platform
Time tracking tool
Replaces Harvest or Toggl: hours logged in Growee already price every project.
Budgeting spreadsheet
Budgets, actuals, and margin computed for you, with no formulas to maintain.
Profitability BI tool
Margins, cost breakdown, and forecast without a separate BI dashboard bolted on.
Resource planner
Weekly allocation and utilization tracked on the same team, no extra tool.
Invoicing bolt-on
Invoices link to projects, so invoiced revenue sits next to cost automatically.
Expense tracker
Project-allocated expenses feed the cost breakdown, no manual tagging afterward.
A second login
One account, one password, one place your team already checks daily.
The whole portfolio, on your phone
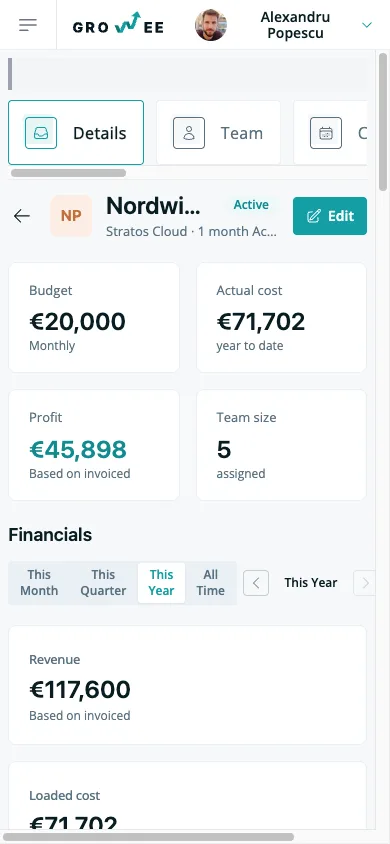
Check a project, read its margin, or see who's allocated from wherever you are: no separate app to install.
Frequently asked questions
Which HRIS shows project profitability from employee cost rates?
Growee does. The employee record carries the internal cost rate, and every timesheet row carries both that internal cost hourly rate and the billed rate, so project margin is built from the cost data HR already holds rather than re-keyed into a separate billing tool. Most HR systems stop at the employee record, and most time trackers stop at billable hours: the margin only appears when the same record holds the salary, the hours and the client rate.
Is a retainer client profitable once salaries and non-billable time are counted?
Growee answers that on the project itself. A retainer takes its revenue from the invoiced fee, and its cost carries every salaried member on the project at their full monthly cost whenever their weekly allocation is the shipped default of 40 hours, whether the hours they logged were billable or not. A retainer that quietly absorbs unbilled work therefore shows the whole salary against a flat fee, and the margin falls. The project view plots the monthly fee against delivered cost month by month, so the drift shows up long before renewal.
Does Growee report margin for fixed price and time and materials?
Yes, with a different revenue basis for each. Fixed price is fee based, so revenue is the invoiced amount once anything is invoiced and the configured budget before that. Time and materials takes the invoiced amount once anything is invoiced, and otherwise values billable hours at each person's billed rate. Cost is assembled the same way for both, with one difference: on a fixed price project every member is costed from logged hours at their internal cost hourly rate, including the salaried ones.
Is project management included in my plan?
Yes. Projects, budgets, profitability, and the portfolio dashboard are part of Growee, not a separate product or a separate bill. If you already have a Growee login, projects are one click away in the sidebar.
How are employee costs calculated?
From one of three sources, resolved per member. A member paid hourly, and every member on a fixed price project, is costed at the internal cost hourly rate on each timesheet row times the hours logged. A member given an explicit fixed monthly cost for that project is costed at that figure. Any other salaried member is costed at their own monthly cost or salary, prorated by their weekly allocation only when it is set below 40 hours. At the shipped default of 40, the full monthly cost lands on that project.
Which billing models are supported?
Six: retainer, fixed price, time & materials, PPC passthrough, revenue share, and internal cost center. Each model resolves revenue the right way (from invoiced amounts, the configured budget, or billable hours), and the profitability view adapts its KPIs to match. Budgets can be fixed or recurring weekly, monthly, or yearly.
Does it work with our time tracking and payroll data?
That's the whole point. Logged hours from time tracking and salary data from payroll feed project costs directly, so budget versus actuals reflects the real cost of delivery. Nothing is exported or re-keyed. The numbers on a project are the same numbers your team already records in Growee.
Can I invoice from projects, and does it handle multiple currencies?
Yes. Invoices link to a project so invoiced revenue sits next to budget and cost, and each project can run in its own currency. Growee converts every currency into your reporting currency for portfolio totals, tracking any unconvertible amounts separately so the numbers stay honest.
Know what every project really costs, starting today
Set up your first project in minutes: no new login, no spreadsheet to maintain.